Australian households have just had their biggest six months of rooftop solar on record, and they bought home batteries even faster. Those are the main findings of the Clean Energy Council's Rooftop Solar and Storage Report for January to June 2026 (opens in a new tab), released on 29 September.
Solar had its biggest half-year
Between January and June, 180,878 rooftop solar systems went onto Australian homes and businesses, adding 1,894 MW. That is 35 per cent more systems and 41 per cent more capacity than the same six months of 2025, and more capacity than any half-year before it. The June quarter did most of the lifting, with 102,234 systems and 1,079 MW, the largest quarter recorded.
Systems are still getting bigger on average. Over the six months to June the average was 10.45 kW, up from 10.00 kW a year earlier. June on its own averaged 9.92 kW, and the Council says it will be watching whether that dip continues.
Batteries grew faster again
The first full half-year of the federal Cheaper Home Batteries Program produced 276,011 home battery installs, 52 per cent more than the 181,428 in the second half of 2025. Every quarter since the program started on 1 July 2025 has beaten the one before, from 70,571 batteries in the September 2025 quarter to 154,140 in the June 2026 quarter. Across the program's first year, 457,439 batteries were installed.
Storage capacity grew faster than the number of batteries. The half added 8,691 MWh, about double the 4,221 MWh added in the six months before, and the program's first year added 12.9 GWh in total.
Batteries got bigger, then smaller
Size explains most of that gap. The average battery installed in July 2025 was 17.2 kWh. By April 2026 it was 35.3 kWh, more than double. Then it fell, to 31.8 kWh in May and 26.6 kWh in June.
The fall starts in May, the month the federal discount stopped paying evenly for every kilowatt hour and began tapering as batteries get larger. Above 28 kWh, each extra kilowatt hour now earns 15 per cent of the certificate factor. The Pulse looked at that change in more detail in how battery sizing split after the taper.
Monthly averages as labelled in Figure 9 of the report. The federal discount began tapering by battery capacity on 1 May 2026.
Data table
| Series | Installation month | Value | Status |
|---|---|---|---|
| Average battery size | Jul 2025 | 17.2 kWh | Reported |
| Average battery size | Aug 2025 | 18.5 kWh | Reported |
| Average battery size | Sep 2025 | 21.2 kWh | Reported |
| Average battery size | Oct 2025 | 23.2 kWh | Reported |
| Average battery size | Nov 2025 | 25.4 kWh | Reported |
| Average battery size | Dec 2025 | 28.4 kWh | Reported |
| Average battery size | Jan 2026 | 29.4 kWh | Reported |
| Average battery size | Feb 2026 | 29.9 kWh | Reported |
| Average battery size | Mar 2026 | 32.2 kWh | Reported |
| Average battery size | Apr 2026 | 35.3 kWh | Reported |
| Average battery size | May 2026 | 31.8 kWh | Reported |
| Average battery size | Jun 2026 | 26.6 kWh | Reported |
More batteries than solar systems
In the first half of 2026, 153 batteries were installed for every 100 rooftop solar systems, up from 130 per 100 in the second half of 2025. The Council reads this as a lot of batteries going onto homes that already have solar, alongside new solar and battery packages installed together.
For a home that already has panels, three questions settle most of the decision.
Where Western Australia sits
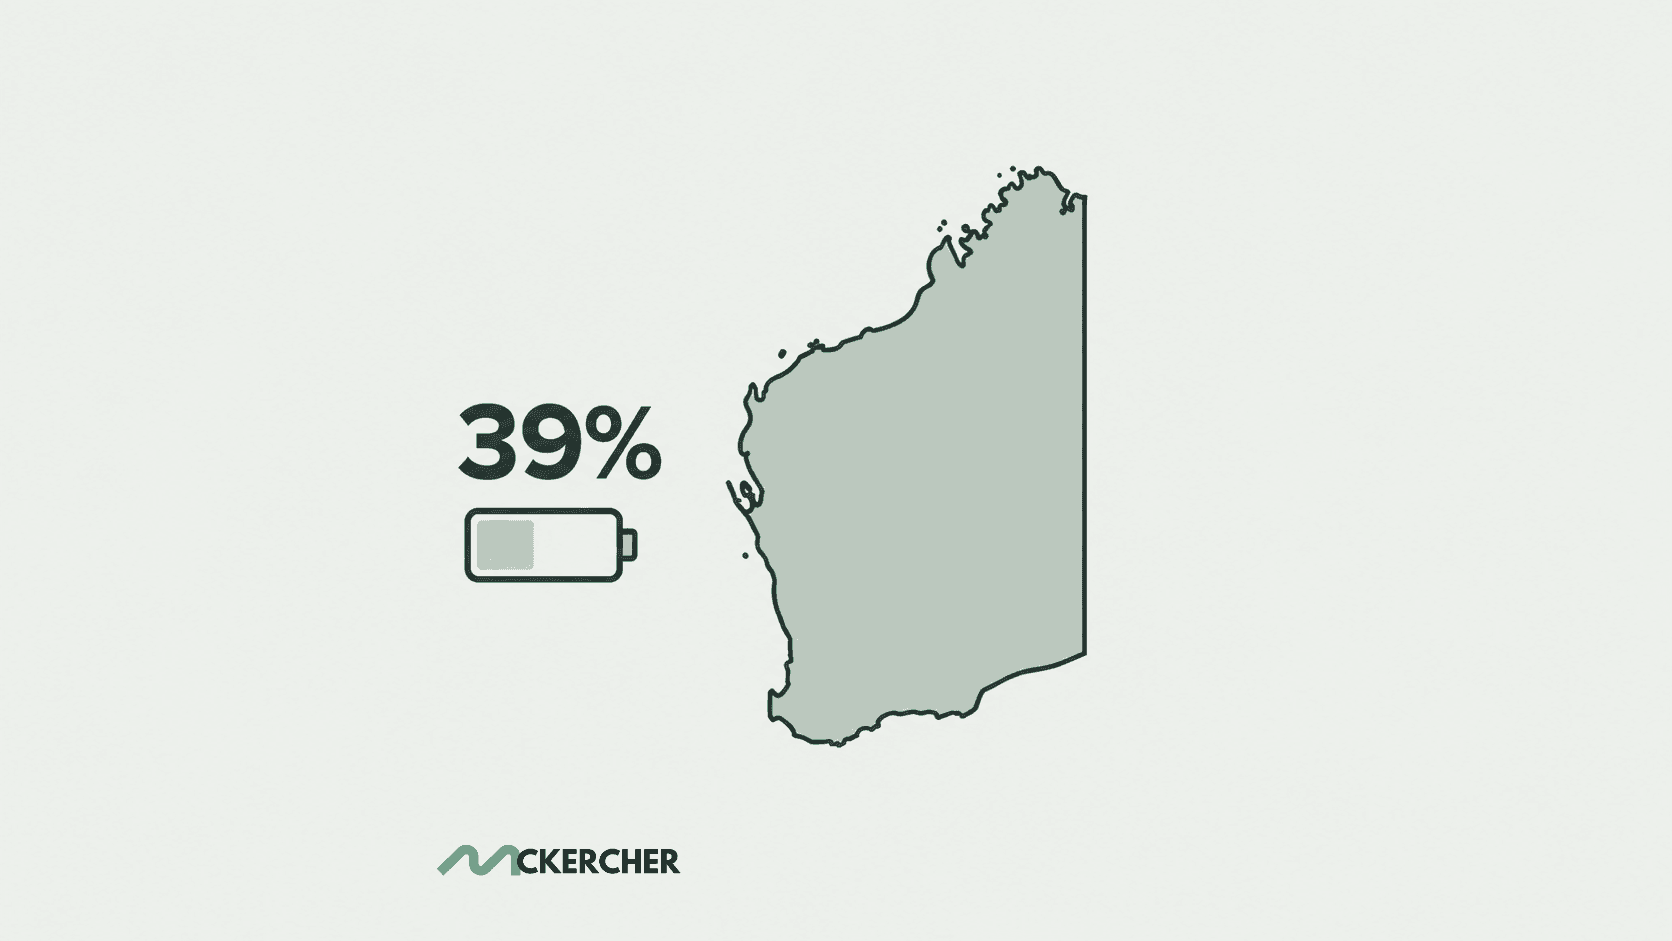
Since January 2019, Western Australia has installed 2,236 MW of rooftop solar, the fourth-largest total behind New South Wales, Queensland and Victoria. The June 2026 quarter was the biggest on record in every state and territory except the Northern Territory and the ACT, Western Australia among them.
The report does not split battery numbers by state. For WA storage, the latest figures come from AEMO's quarterly data for the Wholesale Electricity Market, covered in the Pulse's review of the June 2026 quarter.
Businesses headquartered in WA made up 234 of the 2,389 Approved Sellers under the New Energy Tech Consumer Code at 30 June, about one in ten. The Council puts the faster growth in WA and Queensland down to incentive programs that require Approved Seller status. The code moves to an updated version on 1 December 2026.
Ahead of AEMO's forecasts, in the east
If installs held at their current pace, the Council calculates that rooftop solar in the National Electricity Market would reach 40.3 GW by 2029/30, 13 per cent above AEMO's 2026 Integrated System Plan. Household battery storage would reach 59.2 GWh, 79 per cent above the plan's 33 GWh.
The Council describes this as a measure of momentum rather than a forecast. It rests on one year of data from a subsidised market, and it assumes program settings, prices and demand stay as they are.
Those figures also cover only the National Electricity Market, the connected grid running through Queensland, New South Wales, the ACT, Victoria, South Australia and Tasmania. Western Australia's main grid, the South West Interconnected System, is separate and planned separately, so the comparison says nothing directly about it.
One note on the data itself. The installation counts are based on applications lodged with the Clean Energy Regulator during the period, including some still under review, so they will differ slightly from the Regulator's own published figures. The full report (opens in a new tab) is available from the Clean Energy Council.